Introduction
This page provides an overview about the datasets, which can be interactively explored with the PhageExpressionAtlas.
The following sections cover all the information about the backend of the PhageExpressionAtlas: Where does the data come from? How is the data processed and stored? How are phages and hosts represented across the available datasets?
Data Processing
The PhageExpressionAtlas currently hosts and visualizes time-resolved dual RNA-seq datasets that are publicly available. Time-resolved dual RNA-seq profiles the transcriptomes of a phage infecting its bacterial host over the time-course of infection. This offers insights into phage-host interactions on the transcriptional level such as anti-viral defense by the host or host takeover strategies employed by the phage. Prior to visualization, all datasets are processed with our custom Nextflow pipeline to ensure consistent and uniform processing of dual RNA-seq data. The schematic illustration of the pipeline and the downstream processing steps within a Jupyter Notebook are shown below:
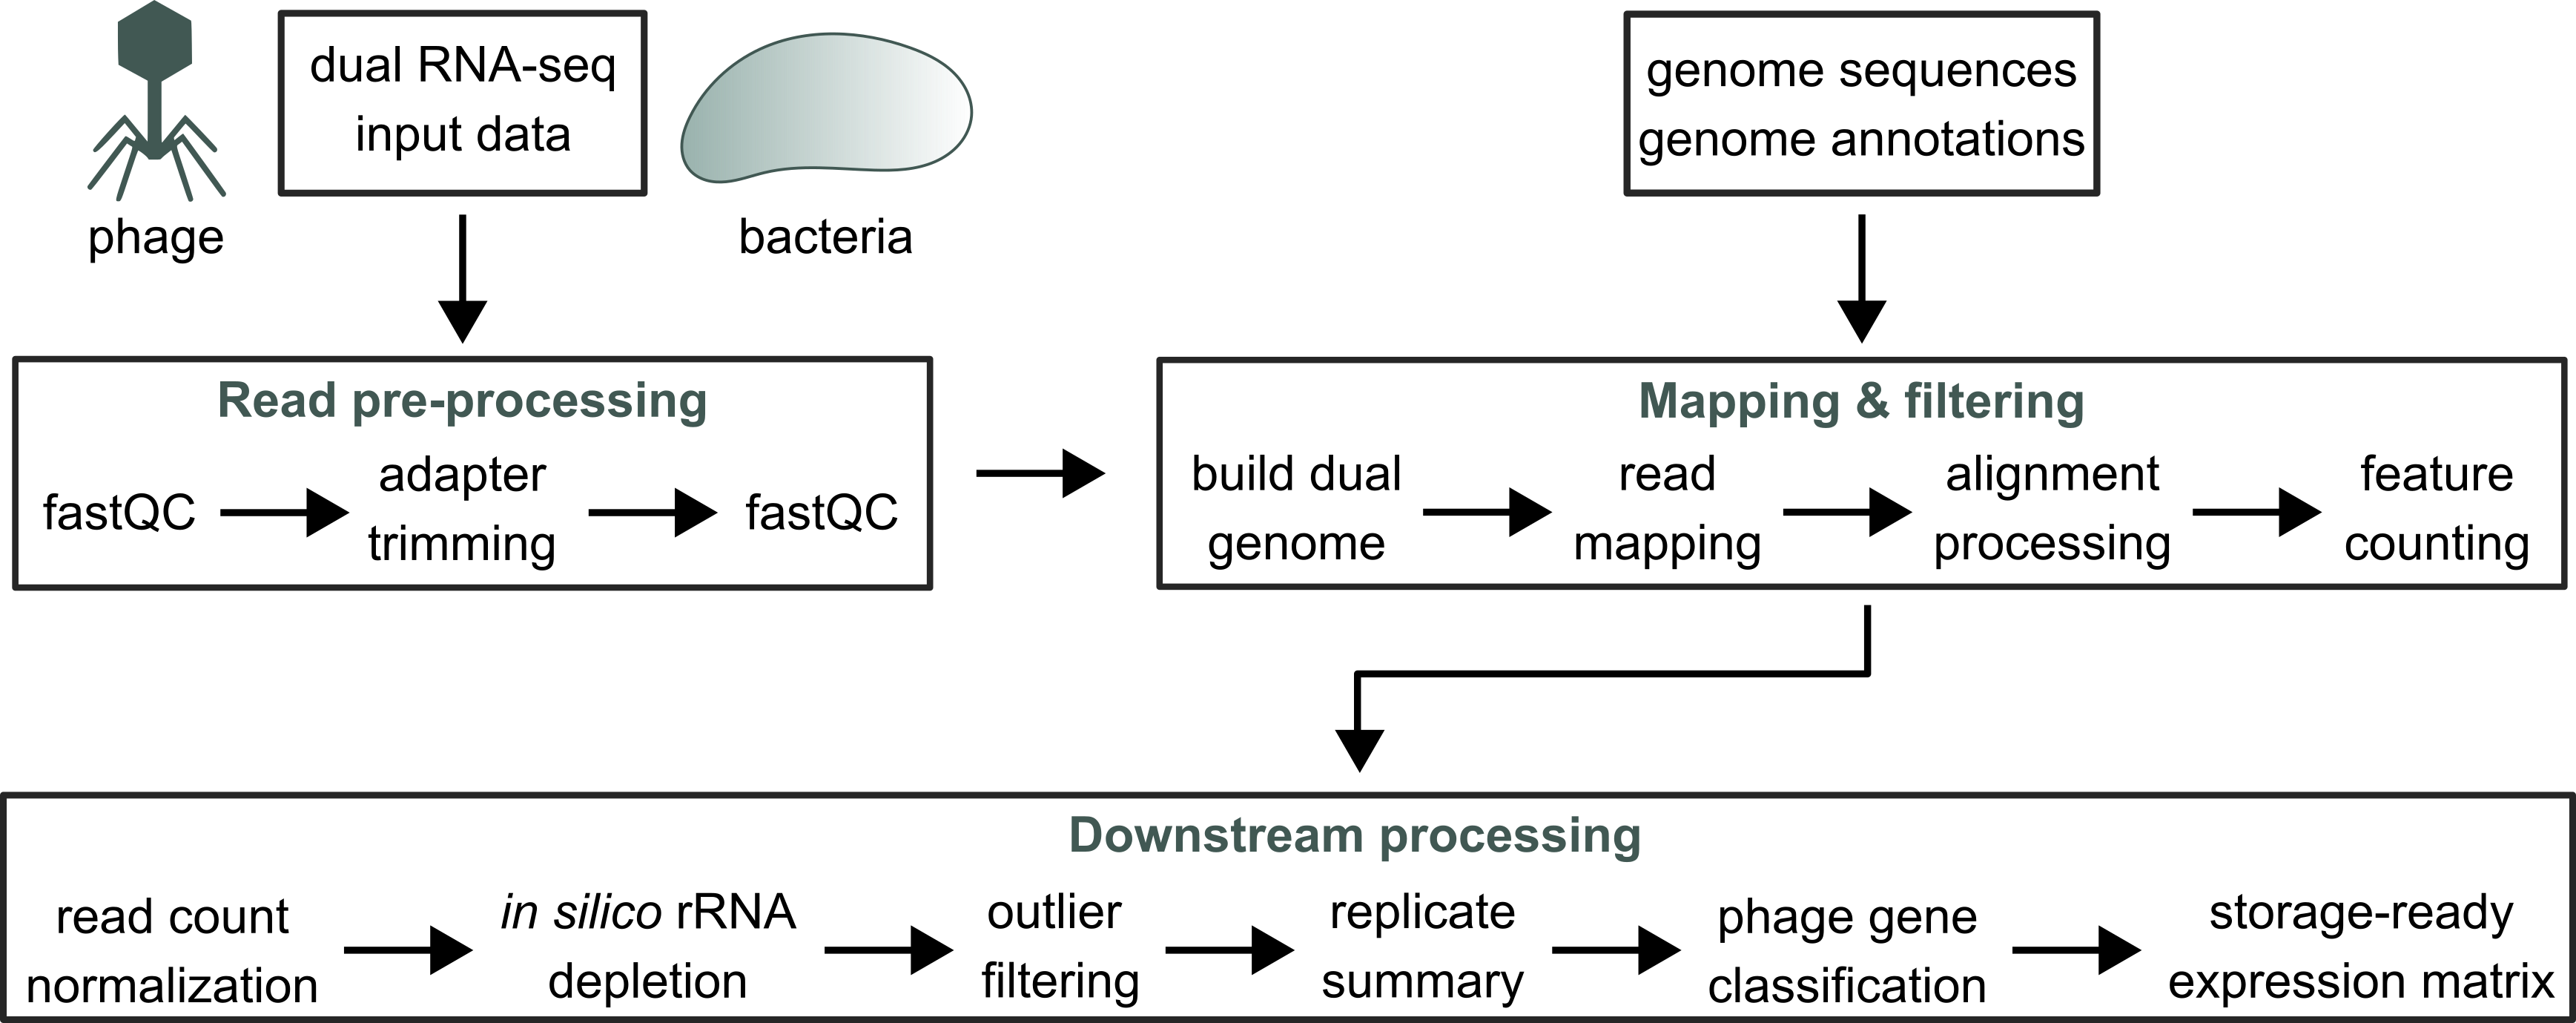
The dual RNA-seq data from a distinct phage infection, mostly time-resolved datasets, as well as the reference host and phage genomes serve as input for the Nextflow pipeline. Subsequently, data is parsed for quality control and adapter trimming by cutadapt, followed by check of adapter removal. The processed read files are then mapped to the dual reference genomes using HISAT2. Dual RNA-seq reads that mapped to host and phage genes are quantified with featureCounts, which are further processed by in silico rRNA depletion, outlier sample removal, read count normalization and replicate summarization. Then, phage genes are classified into early, middle and late based on two possible criteria (either time point of maximum gene expression or time point when 20 % of max. expression is reached) and phage gene functional classes are annotated with Pharokka. This information is attached to the processed count data and the gff file.
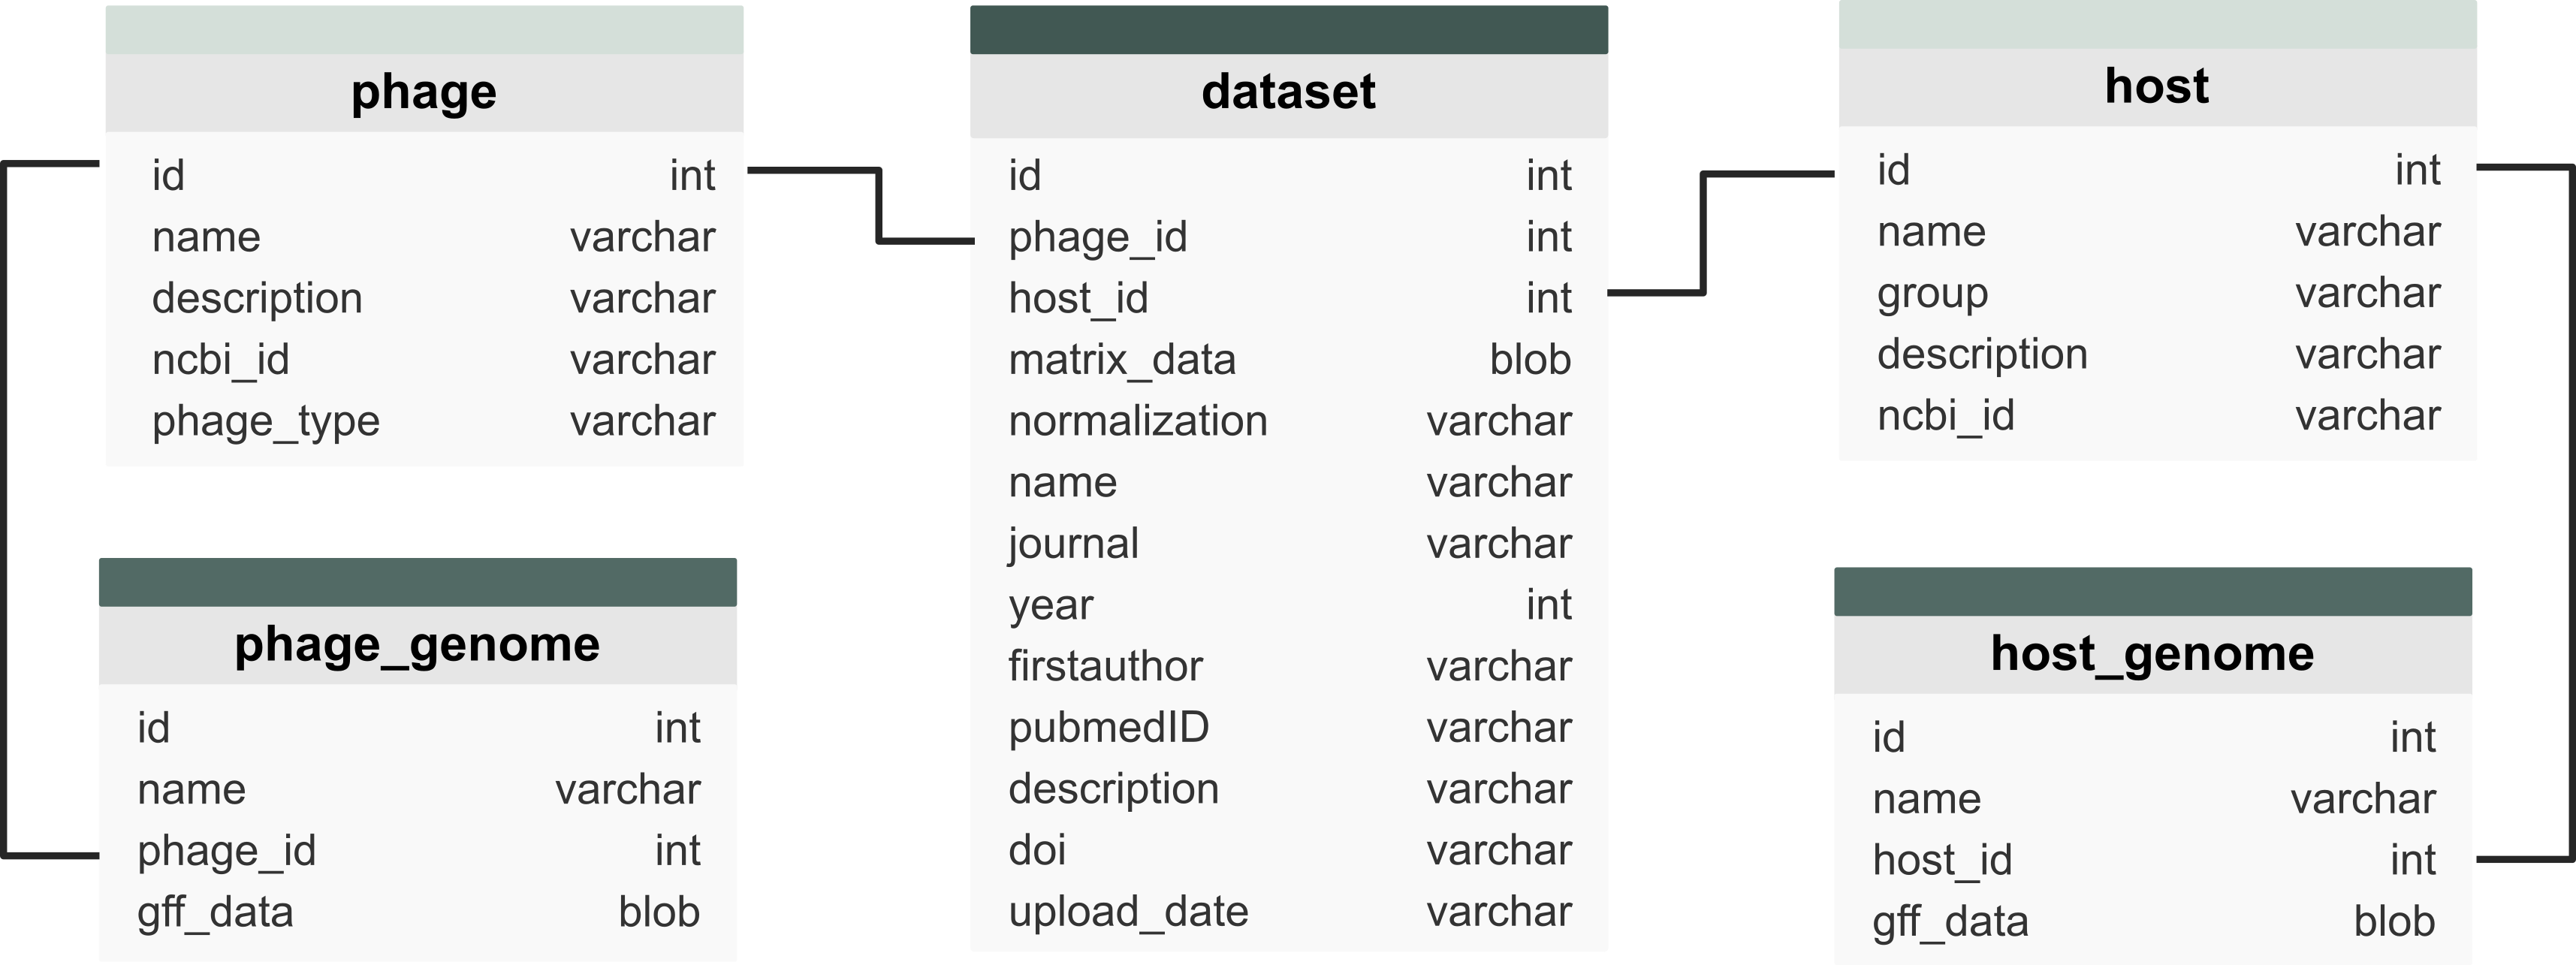
The count data alongside corresponding information on the dataset, the phage and host and their corresponding genomes are stored in an SQLite database. This database consititutes a key part of the backend of the PhageExpressionAtlas and is structured as illustrated below:
Dataset Distribution
Overview of available Phage-Host Interactions
Which phage and host (strain) are present in which datasets from which studies? The following Sankey diagram provides an overview about the dataset constitution:
Proportional Distribution of Phage Lifestyles
Chart illustrating the phage types represented in the PhageExpressionAtlas
Proportional Distribution of Phages across all Datasets
Chart illustrating the abundances of bacteriophages in the datasets available in the PhageExpressionAtlas
Proportional Distribution of Hosts across all Datasets
Chart illustrating the proportions of the diverse host species and associated host strains represented in the PhageExpressionAtlas
Datasets
The datasets hosted and visualized in the PhageExpressionAtlas are collected from various publicly available dual RNA-seq studies of phage infections.
As of today, the PhageExpressionAtlas hosts - datasets.
Explore the data available in the PhageExpressionAtlas in the table below.