- In the current implementation, the PhageExpressionAtlas provides uniformly processed dual RNA-seq data of diverse phage infections for exploration and visualization.
- To find out more about the datasets that are currently hosted on the PhageExpressionAtlas visit Data Overview.
- In order to explore the datasets currently hosted in the PhageExpressionAtlas you may visit the Dataset Exploration page. There, select your dataset and/or phage and host of interest to investigate host and phage gene expression on the transcriptional level. For instance, phage gene classification (early, middle, late) can be obtained and visualized in the genome viewer at their respective genomic location.
Get an overview of the PhageExpressionAtlas and the possibilities it offers. Additionally, find background information about bacteriophages and dual RNA-sequencing.
Take a look at how the data was processed, which phages and hosts are represented in the data and which datasets are available.
Data visualizations in Data Overview:
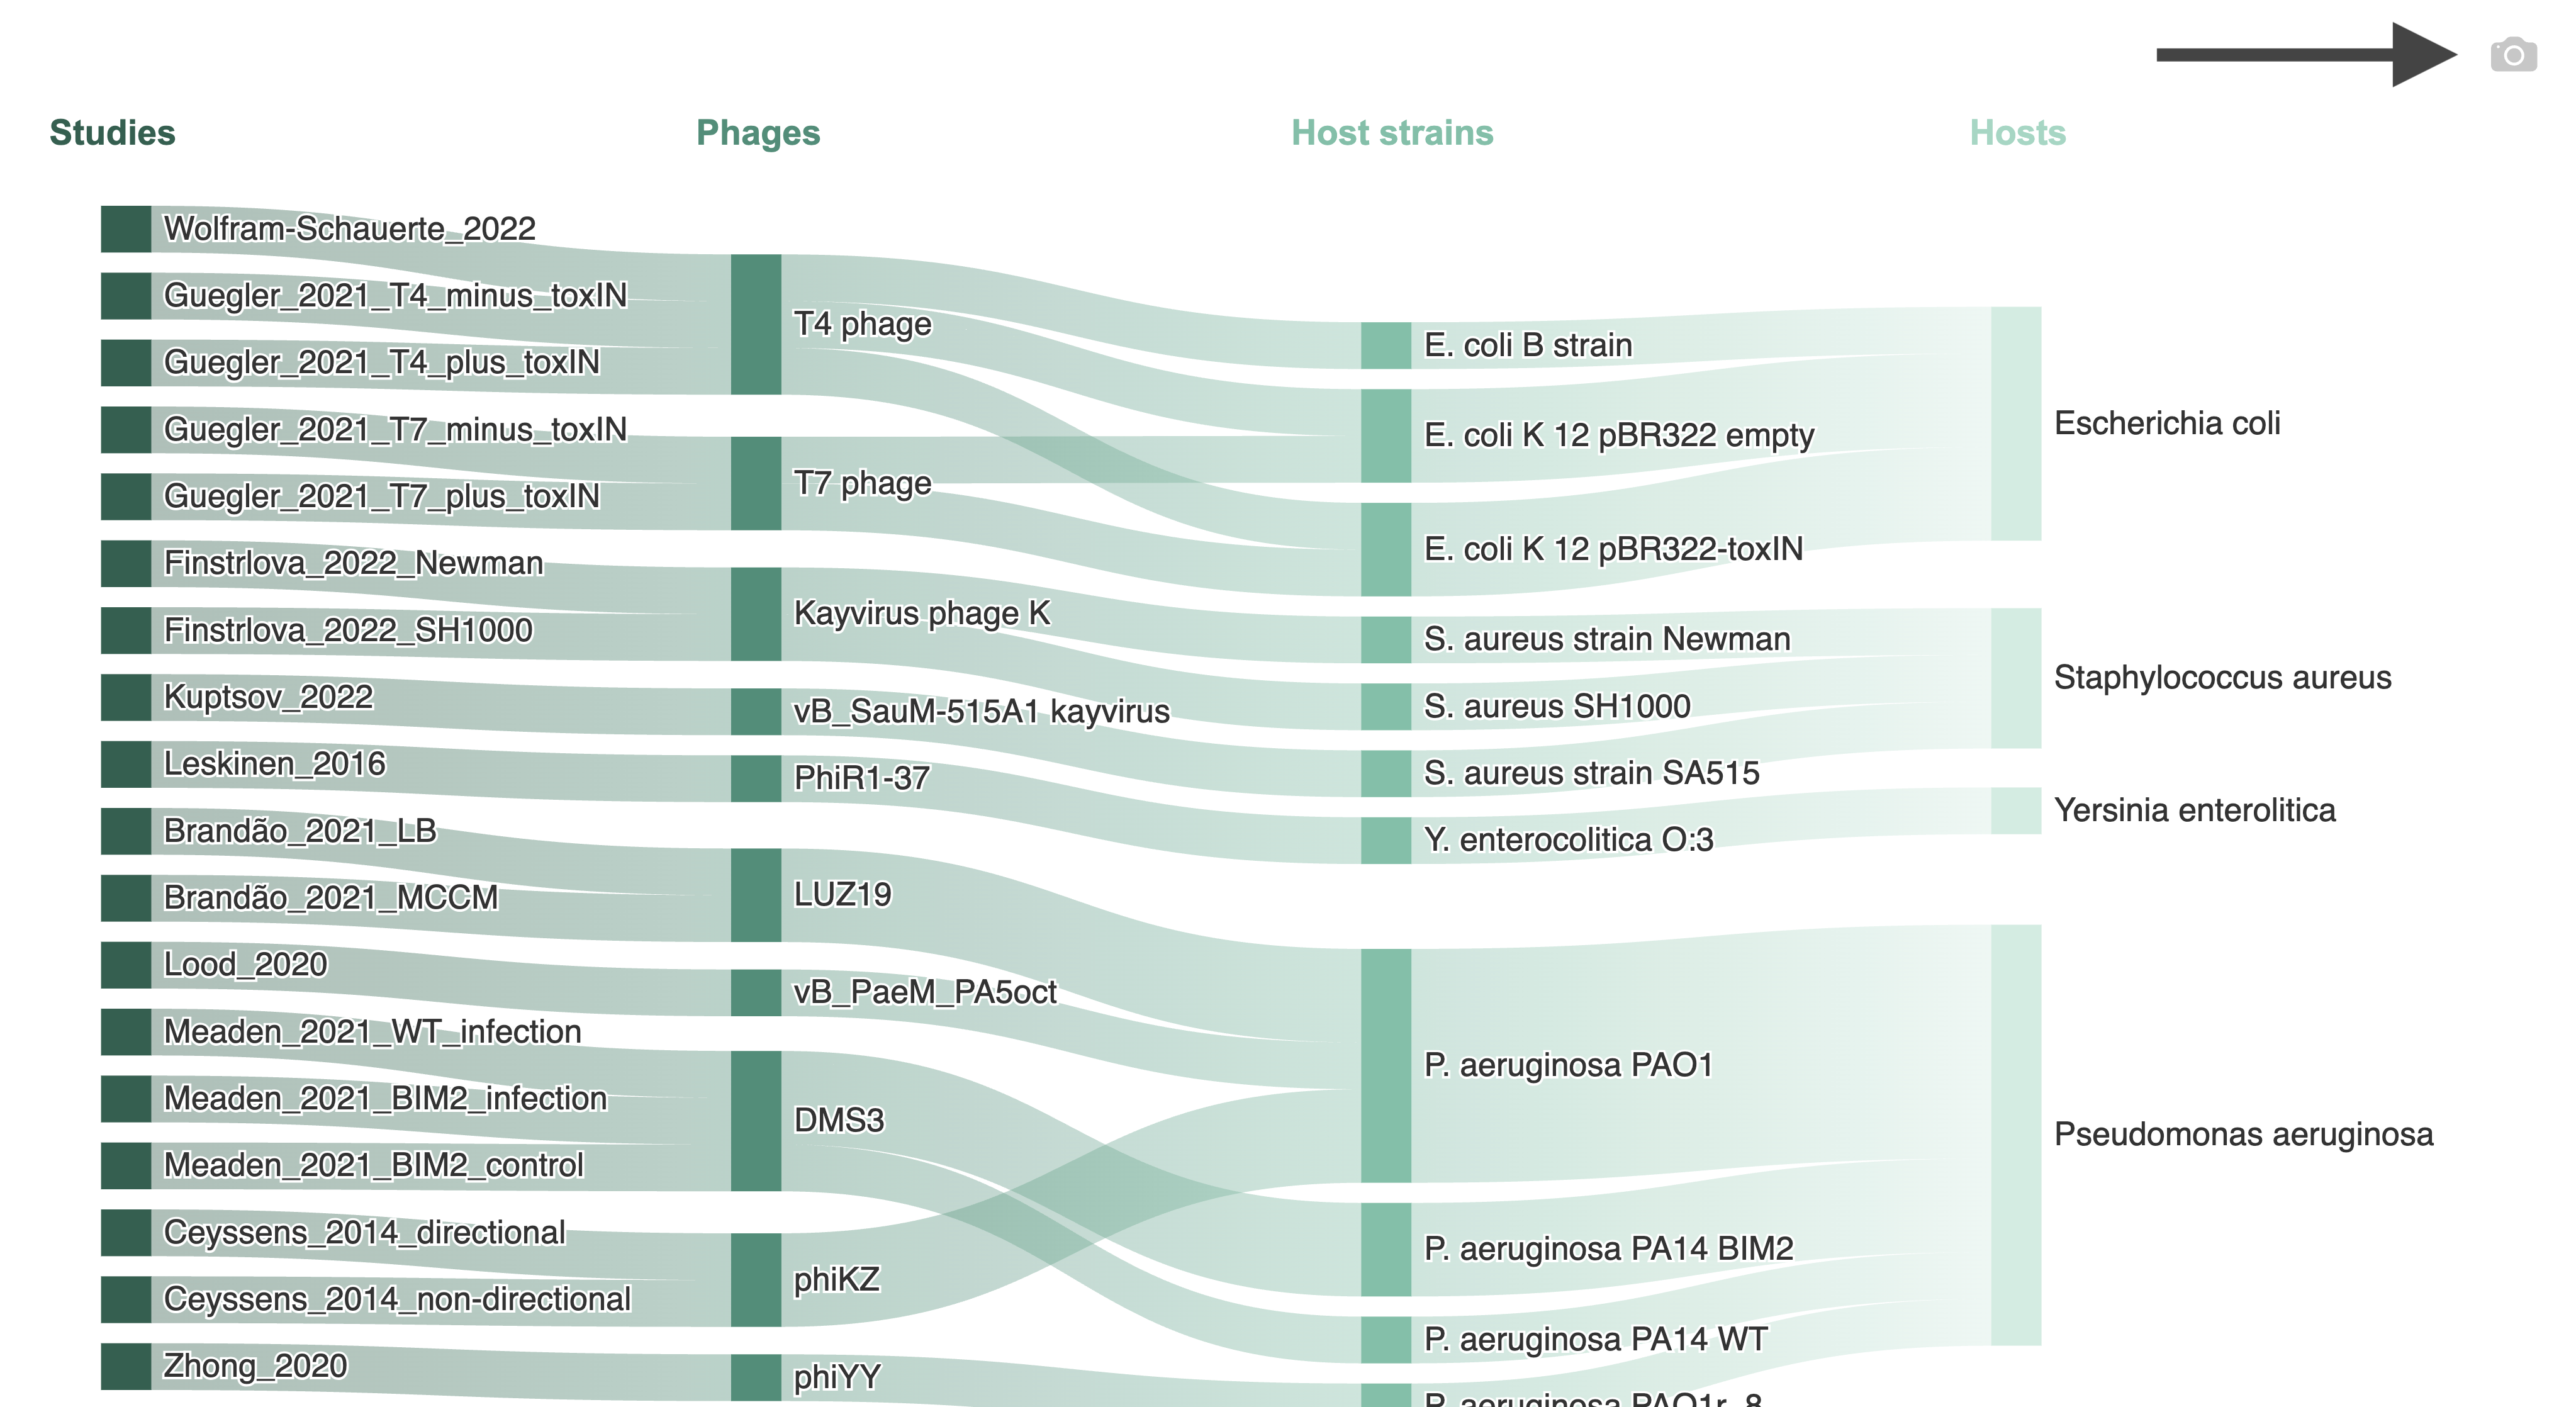
Example: Overview of available Phage-Host Interactions with arrow pointing to the download button
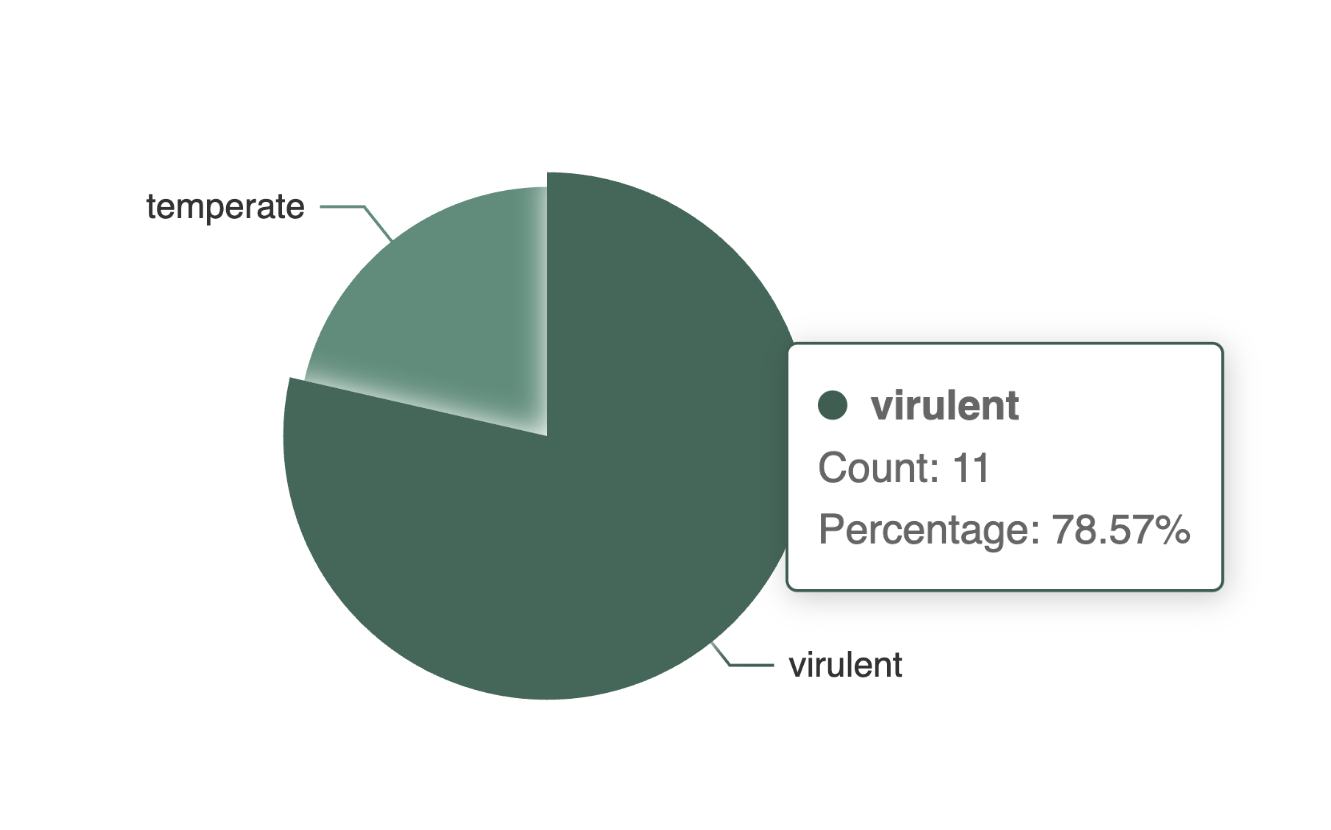
Example: Proportional Distribution of Phage Lifestyles with tooltip
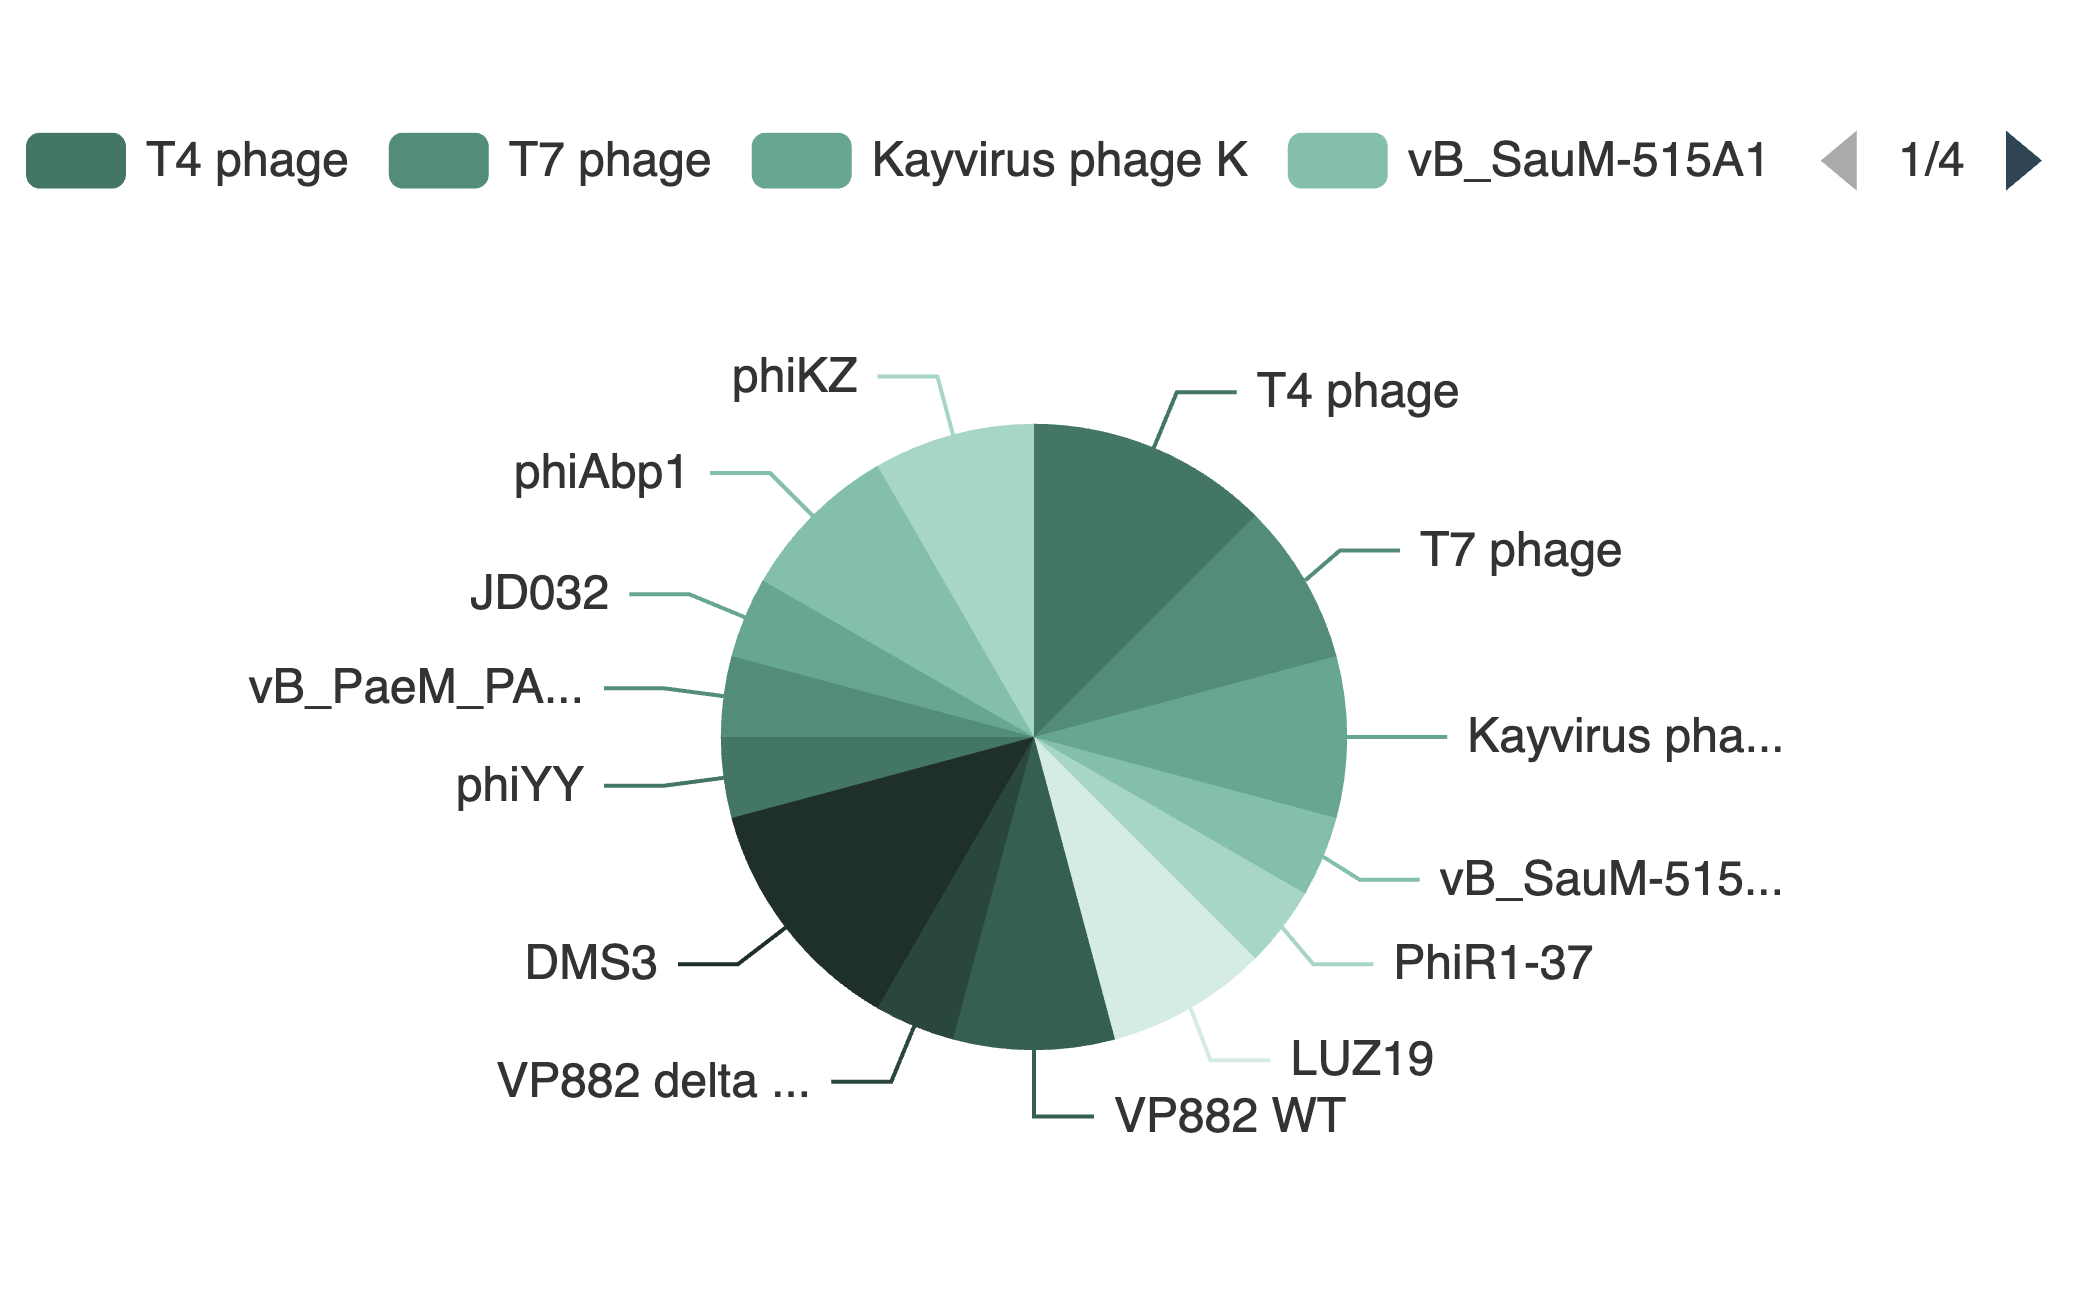
Example: Proportional Distribution of Phages across all Datasets
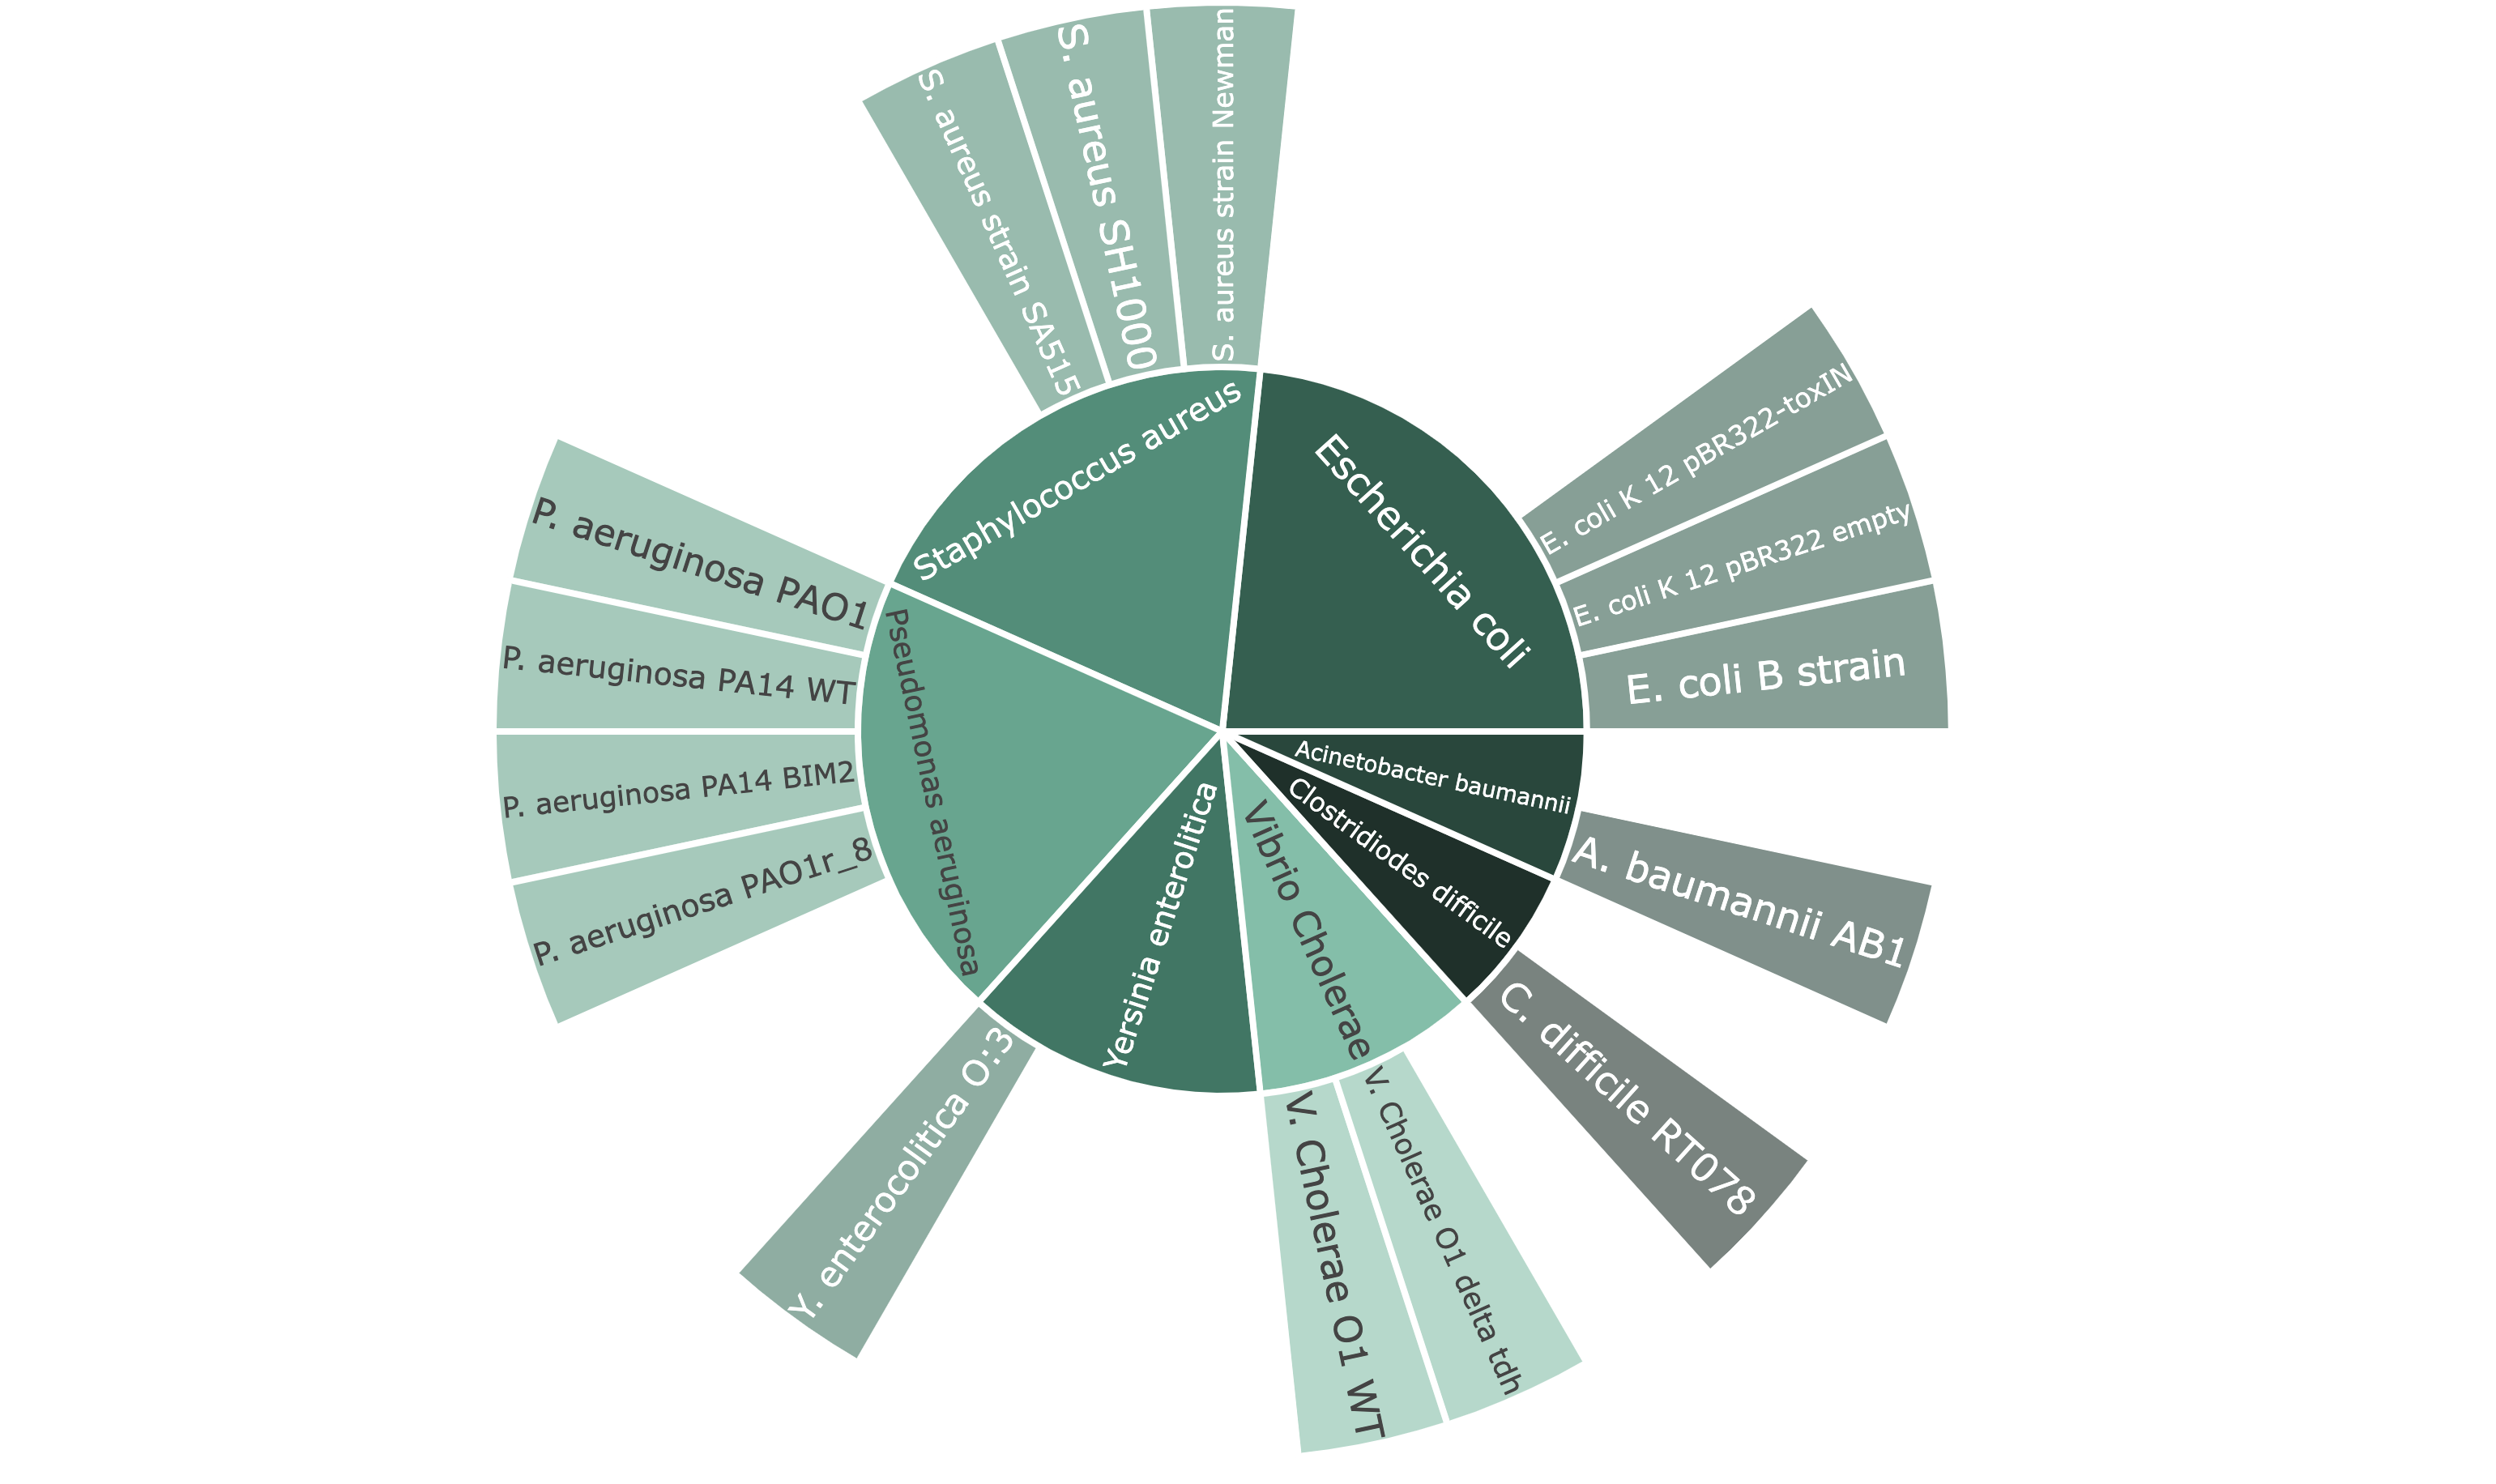
Example: Proportional Distribution of Hosts across all Datasets
Information about the distribution of the PhageExpressionAtlas, such as which phages are currently represented in the atlas, can be explored visually and interactively with the different charts (examples of the charts are shown on the left side).
All Charts can be downloaded as png by click the "
To explore the charts in more detail, simply hover over any part of it. A tooltip will appear showing helpful information such as the percentage, or value of each category .
To hide or display categories in the pie charts, it is possible to click the legend entries above the charts which look like this:
Some legends also include pagination. The pages can be navigated by clicking on "
In the sunburst plot categories can be selected by clicking. To show all categories again, the category has to be clicked again.
Where to find all Datasets currently in the Atlas:
All datasets currently available for exploration in the Atlas can be found on the Data Overview page, under the Datasets section. The video on the right provides a visual guide for the table, where each dataset is represented as a row.
How to navigate the table?
The table contains a variety of details for each dataset — such as the study name, doi, and PubMed id — making it quite long. To view all the information, it is needed to scroll through the table (as shown in the video on the right).
Additionally, the table is paginated. You can navigate between pages using the buttons located below the table. You can also control how many rows are shown at once by adjusting the page size.
The table also offers the option to view a specific dataset in either dataset exploration or the genome viewer, by clicking either "" or "" in the corresponding dataset row. An example on how to navigate the table can be seen in .
Is it possible to filter the table?
Yes, above the table is the filter button located. By clicking on "
Furthermore, each column can be sorted either in descending or ascending order by clicking on "
Can I download the table?
Also yes, the download button is located above the table, adjacent to the filter button. Click "
Example: How to navigate the table
Example: How to filter the table
Explore a dataset of your interest. Inspect overall patterns of host and phage transcription during infection, phage gene classes or study the expression of particular host or phage genes of interest.
Where to start?
After opening the Dataset Exploration page, a specific phage, host and study are already pre-selected in the selection elements on the left. To make your own selections, first select a phage, then a host, and finally the study. Once everything is selected, the visualizations and information will be updated.
Important: When making your selections, make sure you start from the top down, as the selections are mostly interdependent. So no worries, if nothing is selected, the host and study selection items will be empty, so just select your phage of interest and you are good to go.
You can not find your study of interest in the select element?
As mentioned above, the selections are interdependent, so it is possible that you have selected the wrong phage or host and the study is not listed. Feel free to click the "Deselect all" button and start over.
You want to look at a specific dataset and don't know which phage or host to choose?
No worries, just look at the dataset table on the Data Overview page, there is a specific button for each dataset ("") that when clicked will redirect you to the Dataset Exploration page with your study of interest already selected (for more information on the table, please see the Data Overview Guide).
Can i search in the select elements?
As of now, yes and no. When the select is opened and all options are visible, it is possible to enter the starting letters of the option you are looking for. When entering the option window jumps to the first option that matches the letters you have entered. When clicking 'Enter' on your keyboard this first option is being selected. So while you can search, the function is not perfect at the moment.
Data visualizations in Dataset Exploration:
The Atlas offers several visualizations to help you explore phage-host interactions and phage gene classifications within the selected dataset. The primary visual tools include heatmaps and gene expression profiles over time.
These visualizations are organized into two main sections:
- Top Section – Phage-Host Interaction Overview
This area provides a high-level summary of the interactions between phages and their hosts, giving you a quick overview of the dataset. - Bottom Section – Gene-Level Details
If you're looking for more specific insights, this section allows you to select individual genes of interest and examine their expression patterns in greater detail.
Not sure what a graph is showing?
No worries, next to each graph’s title, you’ll find a small "
Can i download the underlying expression data that is being displayed?
Yes! At the top left of the page, you’ll find the information section for the selected study. Right next to it is a download button ("
Can i download the phage gene classification data?
Yes, you can download a CSV table listing all genes and their classifications. To do so, click "" above the Phage Gene Expression Profiles plot.
How to interact with the data visualizations?
All graphs are fully interactive, allowing you to explore the data in more detail. For more details, you can also refer to the video on the right, which demonstrates an example interaction.
Hovering over any data point displays a tooltip with additional information, such as the exact expression value or other relevant details.
Zoom in by clicking and dragging to create a rectangle around the area of interest. Releasing the mouse zooms into the selected region.
To assist with interaction, most graphs feature a set of buttons located above them, each serving a specific purpose:
- - Download the current graph as a PNG image.
- - Click and drag the graph to move to different sections.
- / - Use these to zoom in or out incrementally.
- - Reset the zoom and pan settings to their default state.
- - Opens this Help page for more guidance on how to use the visualizations.
Example: How to interact with a graph in dataset exploration.
In the gene selection section, you’ll also find a linear representation of the phage genome, with selected genes highlighted in color. For guidance on interacting with the linear genome views, please refer to the genome viewer guide section. The genome view in Dataset Exploration additionally provides the feature that each gene is clickable. If a gene is clicked, the respective gene will be selected and all visualizations within the gene selection area will be updated.
Explore the genome of your phage of interest labelled with phage gene classes resulting from a selected dual RNA-seq dataset.
Where to start?
If you are interested in viewing a specific phage genome make your selections on the left side on the genome viewer page or select a specific genome and dataset by clicking the "" button in the dataset table on the data overview page.
Why do I have to choose a dataset/study?
This selection is necessary because the available gene classes depend on the chosen dataset. You can also customize the gene classification method by selecting a threshold, which determines how genes are classified. There are three threshold options available:
- Class Max: classification is based on the gene's highest expression level.
- Class Threshold: classification is based on a defined expression threshold of 0.2.
- Custom Threshold: classification is based on a custom threshold. For each classification (early phase, middle phase, late phase) a time point threshold for can be selected together with a threshold between 0 and 1.
What can I see in the genome visualization?
Once all selections on the left are completed, the genome visualizations on the right will update automatically. These include a static circular view of the phage genome and interactive linear tracks that are linked to it.
Currently, the genome is displayed using two tracks (or rings). In the circular view, the outer ring represents gene classification (which corresponds to the top track in the linear view), while the inner ring (bottom track in the linear view) displays gene biotypes.
Each track consists of genes, that are represented as colored blocks with an arrow indicating its direction — either on the forward strand () or reverse strand (). To know which color represents what, please refer to the legend that is located on the right side of the linear tracks.
How to navigate the genome visualization?
Circular View:
- The circular view of the genome remains static, meaning you cannot zoom in or out or scroll within it. It serves as a high-level overview of the genome.
- A gray window is located within the circular view. This window is used to define the region of the genome being displayed in the linear tracks.
- Dragging the gray window across the circular view will update the linear tracks accordingly. The linear tracks will show more detailed data for the region defined by this window. It is also possible to manually expand the window in the circular view which will then update the linear tracks accordingly.
Linear Tracks:
- The linear tracks on the right side of the viewer are fully interactive, allowing you to zoom in and out for more details or broader views of the genome.
- Zooming in will focus on a smaller portion of the genome, providing more detail. Zooming out will show a broader stretch of the genome, and the corresponding gray window on the circular view will grow in size to represent the expanded view.
- Scrolling through the linear tracks allows you to explore different sections of the genome, letting you move left and right across the dataset.
Detailed Navigation and Interactivity:
- Navigating with the Gray Window:
- Drag the gray window within the circular view to update the corresponding region in the linear tracks by clicking on the window and dragging it.
- Change the size of the gray window by hovering over its border until the "" cursor appears. If it appears, click and drag the window to the prefered size. The linear view will update accordingly.
- The size of the gray window will also change based on the zoom level of the linear tracks, giving you a visual representation of the region you’re focusing on.
- Zooming in and Out:
- Zooming in in the linear tracks gives you more detail for the selected region, while zooming out expands the region. This is done by hovering over your area of interest on the linear tracks and scrolling in with either your mouse or trackpad.
- The views in the circular and linear tracks are linked, meaning any zoom action on the linear tracks is reflected in the circular view.
- Scrolling:
- Scrolling through the genome can be done either by dragging the gray window over the circular view or by clicking and dragging on the linear tracks
- Hovering for Details
- Hover over genes on either the circular genome or the linear tracks to reveal additional details in the tooltip.
- This gives you a quick way to gather information about each gene, such as its location, biotype, and strand.
Example: How to navigate the genome visualization.
- All content is provided for informational and academic purposes only.
- You may access, use, and cite data freely, provided appropriate credit is given to the source and publication.
- Commercial use of the content is not permitted without prior written consent.
Dr. Maik Wolfram-Schauerte
maik.wolfram-schauerte@uni-tuebingen.de
University of Tübingen, Institute for Bioinformatics and Medical Informatics
Sand 14, D-72076 Tübingen
You can let us know and we will process your data and include it in the atlas. Alternatively, you can process that data yourself via our Nextflow pipeline and send the counts table directly to us.
You are interested in how data is preprocessed and stored or how we implemented the frontend of the PhageExpressionAtlas?
Check out our GitHub or feel free to reach out to us. We also welcome report of bugs as issues on GitHub, feedback on general impressions or suggestions for optimization. Thanks for helping to improve the PhageExpressionAtlas.
Data Collection and Use
We do not collect personal data unless you voluntarily provide it (e.g., via email contact). The data will only be used for the purpose for which it was provided and will not be shared with third parties without your consent.
Server Logs
When accessing this website, your browser automatically sends information to our web server. This includes:
- IP address
- Date and time of access
- Browser type and version
- Operating system
Cookies
This website does not use cookies for tracking or advertising purposes. If cookies are used (e.g., for session handling), they are strictly necessary for functionality and are not used to personally identify users.
Contact
If you contact us via email, we will store your message and the contact information you provide for the purpose of responding to your inquiry. This data will not be shared.
Data Subject Rights
You have the right to:
- Access your stored data
- Request correction or deletion
- Object to data processing
- File a complaint with the responsible data protection authority
We assume no liability for any direct or indirect damages resulting from the use of this platform, including decisions made or actions taken based on the data provided. Users are responsible for critically evaluating the content and, where appropriate, referring to the original sources.
For details on data collection, curation, processing, and visualization methods, please refer to the associated publication: Preprint link following soon or PhageExpressionAtlas GitHub Repository and the associated Processing Pipeline.
Current Status of Accessibility:
This website is partially compliant with the applicable accessibility standards. We are working to improve accessibility features such as:
- Text alternatives for non-text content
- Contrast and readability improvements
Current contributors
- Dr. Maik Wolfram-Schauerte (project lead, backend, conceptualization, supervision, funding acquisition)
- Caroline Trust (design, frontend, conceptualization)
- Nils Waffenschmidt (backend)
- Prof. Dr. Kay Nieselt (supervision, funding acquisition)
- Shoelace
- Description: Library of web components.
- License: MIT
- Version: 2.20.0
- CDN provider: jsdelivr.net
- ECharts
- Description: Library for charting and visualization.
- License: Apache License 2.0
- Version: 5.4.0
- CDN provider: jsdelivr.net
- ECharts Wordcloud
- Description: Word Cloud Extension based on ECharts and wordcloud2.js
- License: Apache License 2.0
- Version: 2.1.0
- CDN provider: jsdelivr.net
- Plotly.js
- Description: Library for charting.
- License: MIT
- Version: 3.0.0
- Gosling
- Description: Toolkit for genomics data visualization
- License: MIT
- Version: 1.0.0
- Tabulator
- Description: A JavaScript library for creating interactive data tables.
- License: MIT
- Version: 6.3.0
- CDN provider: unpgk.com
- Axios
- Description: A promise-based HTTP client for making requests in JavaScript.
- License: MIT
- Version: 1.8.4
- CDN provider: jsdelivr.net
- Flask
- Description: A lightweight WSGI web application framework.
- License: BSD-3-Clause License
- Version: 3.1.0
- Papaparse
- Description: CSV Parser.
- License: MIT
- Version: 5.5.2
- JSZIP
- Description: Library for creating, reading and editing zip files.
- License: MIT
- Version: 3.10.1
- Es Module Shims
- Description: Tool that polyfills import maps and other ES Modules .
- License: MIT
- Version: 2.0.10
- unpkg (for CDN management)
- Description: A fast, global content delivery network for everything on npm.
- jsdelivr (for CDN management)
- Description: A free CDN that serves JavaScript libraries, CSS frameworks, and other assets with high speed and reliability.
Please let us know!